Live order flow in your browser
The market moves before the chart. Now you can see why.
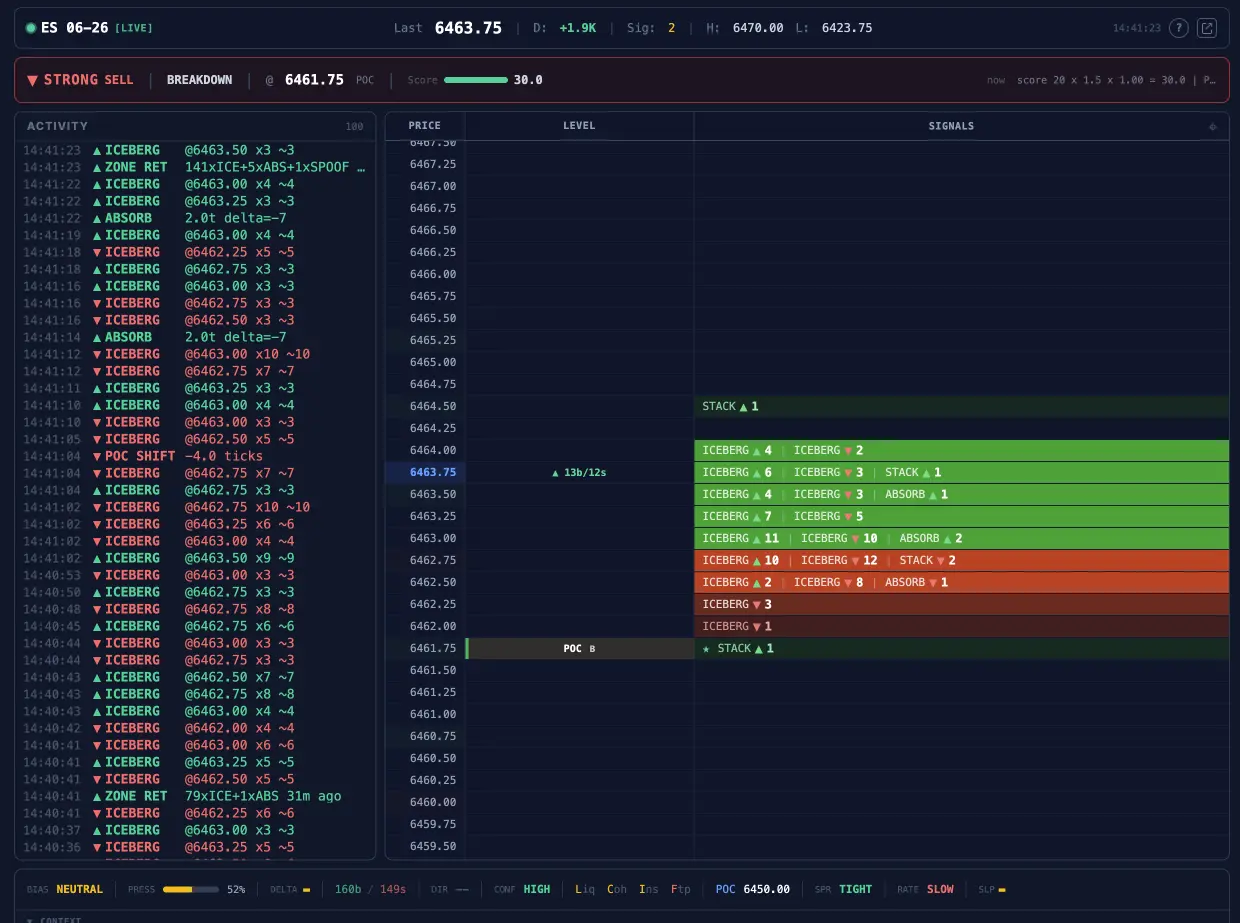
Book depth, absorption patterns, iceberg orders, spoofing detection, VWAP, standard deviations, POC, and key volumetric levels — all projected live on the tape. See who is dominating the market, where the real support and resistance levels are, and when conditions align for a trade. No charts, no platforms, no extra indicators. Just open your browser and trade with your platform.
- All-in-one: everything you need to trade, in one screen
- Live volumetric levels: VWAP, deviations, POC on the tape
- Institutional flow: iceberg, absorption, spoofing detection
- No platforms or data feeds to install — just your browser
Why traders choose it
Open the browser, you're ready
No platforms to install, no data feeds to configure, no indicators to stack. EchoTape gives you book depth, volumetric levels, order flow, and institutional detection in one screen. Everything you need to trade, already running.
One screen. Zero setup.
See who is moving the market
Iceberg orders, absorption at key levels, spoofing — detected and classified in real time. You don't just see price move, you see why it moves and who is behind it, before it shows on the chart.
The footprint behind the price.
VWAP, POC, deviations — live on the tape
Key volumetric levels are projected directly on the order flow. You see in real time whether price is approaching a support, a resistance, or a vacuum zone — without switching between charts and tools.
The levels that matter, where you trade.
You're making decisions with incomplete information
You see price move and you react. But price is the last thing that moves. Before price changes, institutional participants leave fingerprints in the order book: iceberg orders, absorption at key levels, spoofing to manipulate sentiment. By the time you see the candle, the setup is over.
The information exists. It's in the tape, in the order flow, in the microstructure. But extracting it requires infrastructure you don't have: real-time processing of every tick, statistical classification of order types, pattern detection across multiple time horizons, and the computational power to do it all within milliseconds.
So you trade with charts, lagging indicators, and gut feeling. Meanwhile, the participants moving the market are operating with a completely different information set. You're not wrong about the market — you just can't see what they see.
- You enter based on price action while institutional flow already shifted direction seconds ago
- You can't distinguish between genuine breakouts and spoofing-driven fake moves until it's too late
- You miss absorption patterns at key levels that would have confirmed your thesis or warned you to step aside
- You have no way to assess whether current market conditions actually support the trade you're about to take
How it works
EchoTape reads the market through the lens of institutional participation. Every tick is classified, every order pattern is evaluated, and the aggregate state is synthesized into three levels: what institutions are doing, what the market structure supports, and what action the signal confluence suggests. The dashboard streams everything in real time, giving you the same informational edge as institutional desks — without the infrastructure cost.
The theory is clear. But how does it play out in practice? Let's see it on a real scenario — one that repeats every single session.
See the example: absorption at VWAP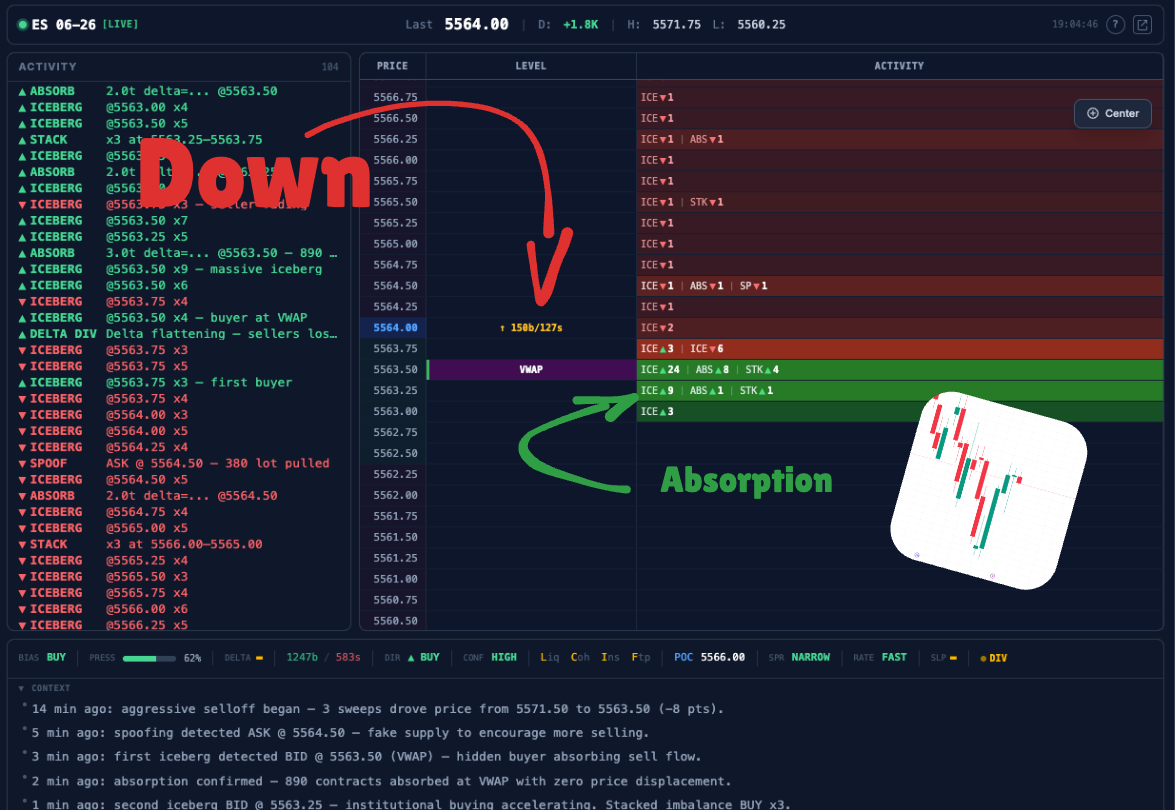
Red candles, momentum is down, the move looks strong. Many open shorts or tighten stops, expecting a breakdown. The chart says "sell."
EchoTape shows the VWAP level directly on the tape. As price arrives, you see large passive buyers appearing. Iceberg detection fires. The flow is shifting: aggressive sellers keep hitting, but the price won't move. The signal is not SELL, it's WAIT.
Price stalls at VWAP. Nothing dramatic happens. Many traders get impatient or assume the pause is temporary before another leg down.
The absorption alert fires: large passive orders are absorbing every contract thrown at the bid without price displacement. The stacked imbalance detector confirms buyers are loading at this level. The heatmap shifts from red to green. Equilibrium is rebuilding. The market assessment changes to BUY.
A sudden green candle. Price snaps back. Shorts scramble to cover. By the time the chart confirms the reversal, the best entry is gone.
You saw the BUY signal before the move started. You were positioned at the level where institutional buyers were already committed. Your entry is at the best price of the session. Not because you predicted the future, but because you read what was actually happening in the order flow.
The edge is not prediction. It's reading what's happening right now, faster and more accurately than any chart could show you.
This is absorption — a concept from market microstructure theory. When passive orders absorb aggressive flow without price displacement, it signals a shift in the supply-demand balance. EchoTape detects this in real time through iceberg detection, flow analysis, and stacked imbalance alerts.
Based on market microstructure research: price formation, order flow imbalance, and the information content of the limit order book.
Under the hood
Who is behind the move
Institutional Activity
Iceberg orders, absorption, spoofing — detected and classified in real time. You don't just see price move, you see who is driving it and whether the pressure is genuine or manufactured.
Where the market reacts
Volumetric Levels
EchoTape analyzes the last 30 sessions to identify key volumetric levels: VWAP, standard deviations, POC and high-volume nodes. These levels are projected onto the live tape so you can see in real time when price approaches a zone where the market has historically reacted. Each level tracks how many times it has been tested during the current session and whether it held or broke, giving you immediate context on its strength.
Should you be trading right now
Market State
Liquidity, coherence, institutional presence, and structure — scored and explained in plain language. Before taking a trade, you know whether current conditions actually support it.
Getting started
Start your free trial
Create your account and activate the 14-day free trial. No charge until the trial ends, cancel anytime.
Open the dashboard
Navigate to the live page. The connection starts automatically and data begins streaming in real time.
Read the institutional flow
Watch signals, assessments, institutional detection, and price levels update in real time. Pop out the dashboard to a separate window for your trading setup.
Why this is different
You only need a broker.
EchoTape handles the rest.
No platforms to buy. No data feeds to subscribe to. No indicators to configure. With EchoTape you get book depth, order flow, volumetric levels, and institutional detection — all in your browser, ready in one click. The only thing you need is a broker to go to market. Use whatever platform you prefer to execute: NinjaTrader, Sierra Chart, TradingView, Quantower, ATAS, Bookmap, Jigsaw, or any other. EchoTape gives you the information. You choose where to trade.
Ready to see what the institutions see?
Live demo
Watch EchoTape in action
A real session on E-mini S&P 500: from institutional flow analysis to market entry, all the way to target profit.
How EchoTape was built
EchoTape is not an indicator repackaged as a service. It is a distributed system where multiple specialized components work together: market data acquisition, real-time order flow processing, statistical analysis on historical data, and a live dashboard. Behind every detection — iceberg, absorption, spoofing — there is formal analysis on months of collected tick data, not intuition.
Research & Formal Analysis
Every pattern detected by EchoTape was first isolated on historical data, statistically validated, and tested for persistence across different market regimes. The research phase produced the classification models that the system uses in real time.
- Statistical analysis on months of tick-level market data
- Classification models for iceberg orders, absorption, and spoofing
- Formal validation of pattern persistence across market regimes
- Multi-dimensional market state framework with scoring criteria
Engineering
Multiple specialized systems, each optimized for its role. Data acquisition processes every tick from the exchange. The core engine classifies patterns and generates signals in real time. Statistical models were developed and validated on historical datasets. The live dashboard delivers everything to your browser instantly.
- Tick-by-tick data acquisition and order flow processing
- Real-time signal engine and pattern classification
- Statistical analysis, model validation, and backtesting
- Live dashboard with real-time visualization
Live Validation
The system is used daily by the developer on his own trading account with real capital. Every model, every threshold, every classification rule is validated against live market conditions — not just historical data.
- Daily live trading with EchoTape signals on real capital
- Continuous model recalibration across changing regimes
- Performance monitoring and threshold tuning on live data
What's included
- Full book depth without subscribing to any special data feed
- Institutional activity detection: iceberg orders, absorption, spoofing
- Key volumetric levels live on the tape: VWAP, POC, standard deviations
- Market state assessment explained in plain language
- Works on any device with a browser — nothing to install
- Pop-out window for multi-monitor setups
- 14-day free trial — full access, cancel anytime
Same desk. Same signals. Your browser.
When a software engineer starts trading

Alessandro Ruggieri
Senior software engineer & developer of Valor
I built EchoTape because I needed it. I was reading order flow every day on futures, processing institutional patterns manually, and losing opportunities to the speed of my own cognition. I could see iceberg orders forming, absorption happening at levels, spoofing shifting sentiment — but by the time I confirmed what I was seeing, the move was done.
So I engineered the system that does it in milliseconds. EchoTape is the order flow engine running on my own trading desk, analyzing every tick, classifying every pattern, and synthesizing it all into actionable signals. EchoTape Live streams that same analysis directly to your browser.
This is not a product I built to sell. It's the tool I built to trade with. You're seeing exactly what I see, in real time, with zero delay.
Try it free for 14 days
Full access to every feature for 14 days, no charge. If EchoTape doesn't change the way you read the market, cancel before the trial ends and you pay nothing. No questions asked.
What it would cost to build this yourself
Building a system like EchoTape requires three things that are extremely hard to combine: deep order flow expertise, real-time systems engineering, and years of live market validation.
A custom order flow detection system with iceberg, absorption, and spoofing classification would cost €5,000–15,000 to develop from scratch. Add real-time streaming, AI narrative generation, and a browser-based dashboard, and you're looking at months of development and tens of thousands in engineering costs.
But the real cost isn't the code — it's the research. Years of trading, pattern identification, and validation that determine which signals actually carry predictive value. That research is what makes EchoTape work. The code is just the delivery mechanism.
With EchoTape Live, you get access to that entire system — signals, assessments, institutional detection, everything — for a monthly subscription. No infrastructure to maintain, no code to write, no research to replicate.
€49/mo
Early adopter pricing. Includes 14-day free trial. Price will increase as features are added.
Frequently asked questions
Questions about EchoTape Live?
Ask anything about the dashboard, the signals, or how it fits your trading workflow. Answers come directly from the developer.